
PS1 Environmental Analysis
 The Project Architecture and Engineering Program (PAE) at Steven’s Institute of Technology has a long-standing relationship with the PS1 Young Architects Program. Student teams from Steven's have made significant contributions to the realization of many winning entries over the life of the program. This year, I along with two other students were asked to contribute by providing environmental analysis to confirm and validate the design of MOS Architect's winning scheme "Afterparty". (Image by MOS)
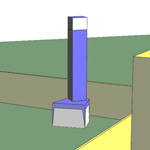 My contribution was to investigate the stack effect conditions created by the 40' conic towers. Working under the guidance of Matt Herman, instructor at Steven's, of Buro Happhold, I completed a study of a single tower utilizing IES's Macroflow tools. While short of a complete CFD (computational fluid dynamics), Macroflow simulates airflows by combining environmental data, primarily weather and solar radiation, as well as specific material and geometric properties to output airflow at openings. By strategically constructing an IES model, many data points can be created and output. (Click any thumbnail to view the image gallery)
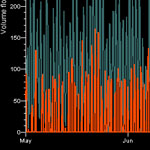 I simulated 24 hours of airflow for 5 months, bracketing the length of the installation, and created a database for the inflowing and out flowing air volume at multiple openings on the interior, top and bottom of the structure. I calculated averages for each hour of the day within each month to create a data point for the average day per month. I quickly found that I needed to visualize this data to best understand what was occurring in the simulation as well as to present that data the architects. I decided the best way to "show" what was occurring would be to scroll through the data in "real-time". We had a preexisting Rhino model of the installation and I knew enough about Grasshopper to know it was capable to do what I needed.
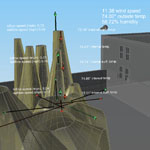 In Grasshopper, I created a VB-Script node which would read the Excel database and output the numeric values to other nodes which controlled geometry of elements and display the data as text within the model space. Using built-in sliders I created an interface where a user/presenter can select any time of day for any day of the 5 months as well as the monthly average values and see those updated in the model in real-time. Because Grasshopper renders directly to the Rhino viewport normal spatial navigation is possible allowing for interactive viewing of the data within the space of the model.
 Bill
Bill